Ways of Working115
Balancing Act
How do organizations prioritize strategically important work with significant capacity constraints?

Evan Leybourn
April 7, 2024
How do organizations prioritize strategically important work with significant capacity constraints?
Evan Leybourn
April 7, 2024
Balancing Act: How do organizations prioritize strategically important work with significant capacity constraints?
This study investigates how business areas make planning and prioritization decisions. We seek to uncover insights into more effective strategies for handling the ever-present tension between ambition and capacity.
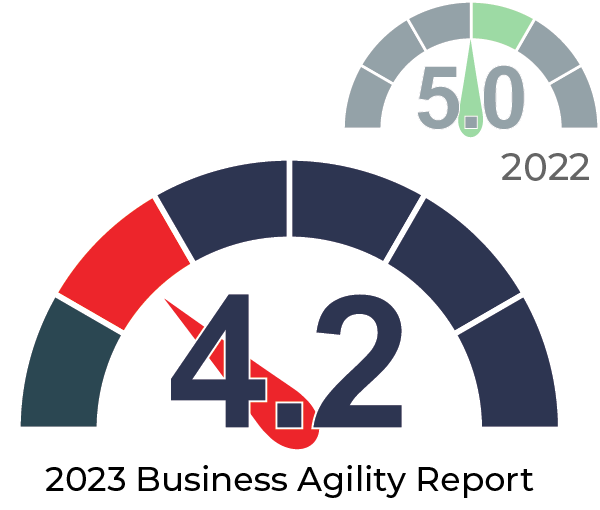
Since 2022, collaboration behaviors have dropped more than 8% (from 5.0 in to 4.2 in 2023).
79% of business areas say that they are faced with significantly more strategically important work than they have capacity to deliver.
The breakdown in collaboration has driven a decrease in cross-organizational prioritization. Priorities are being set in isolation with limited consideration of other business areas.
Prioritization allows people to focus, eliminates the time wasted, and accelerates time to completion on what’s most important.
Learn more about the Domains of Business Agility.
We asked organizations to share the most common approaches they used to prioritize multiple, strategically-important, requests. Categories included:
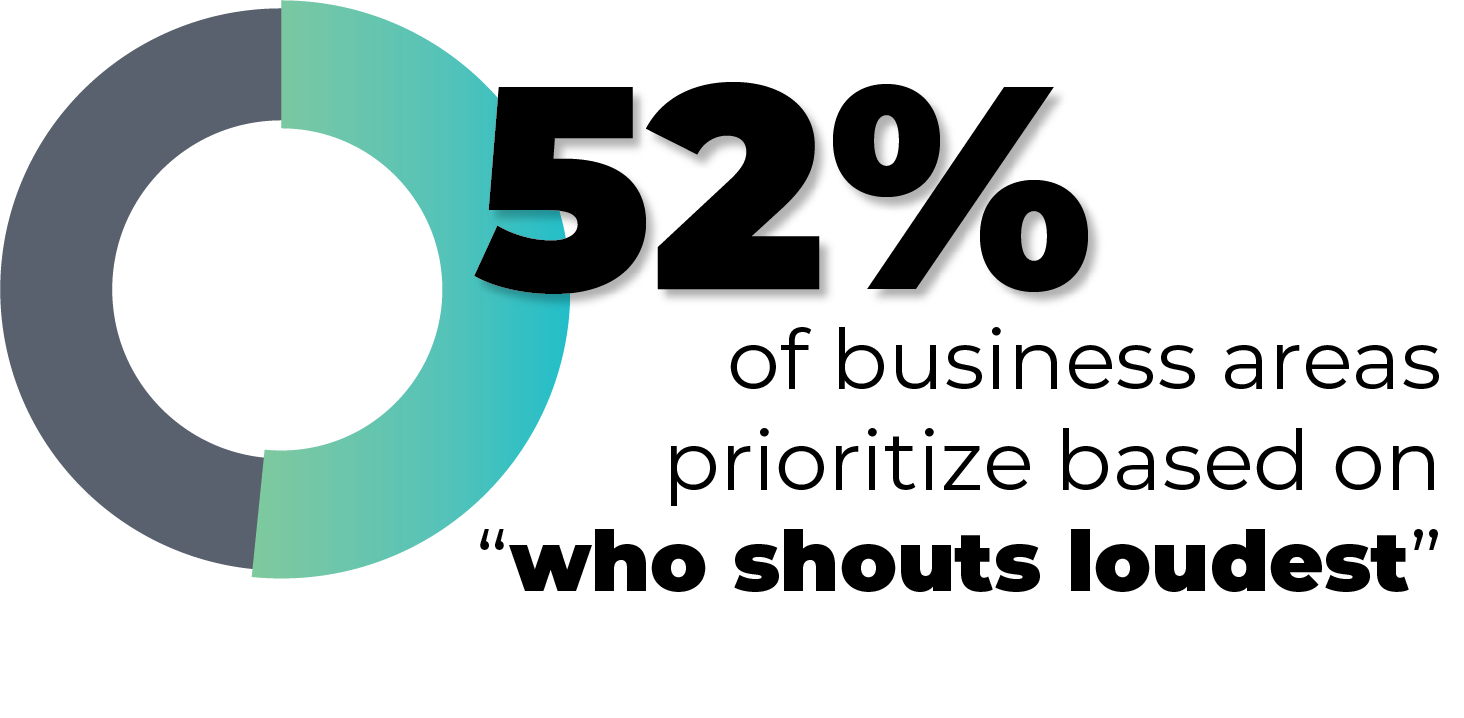
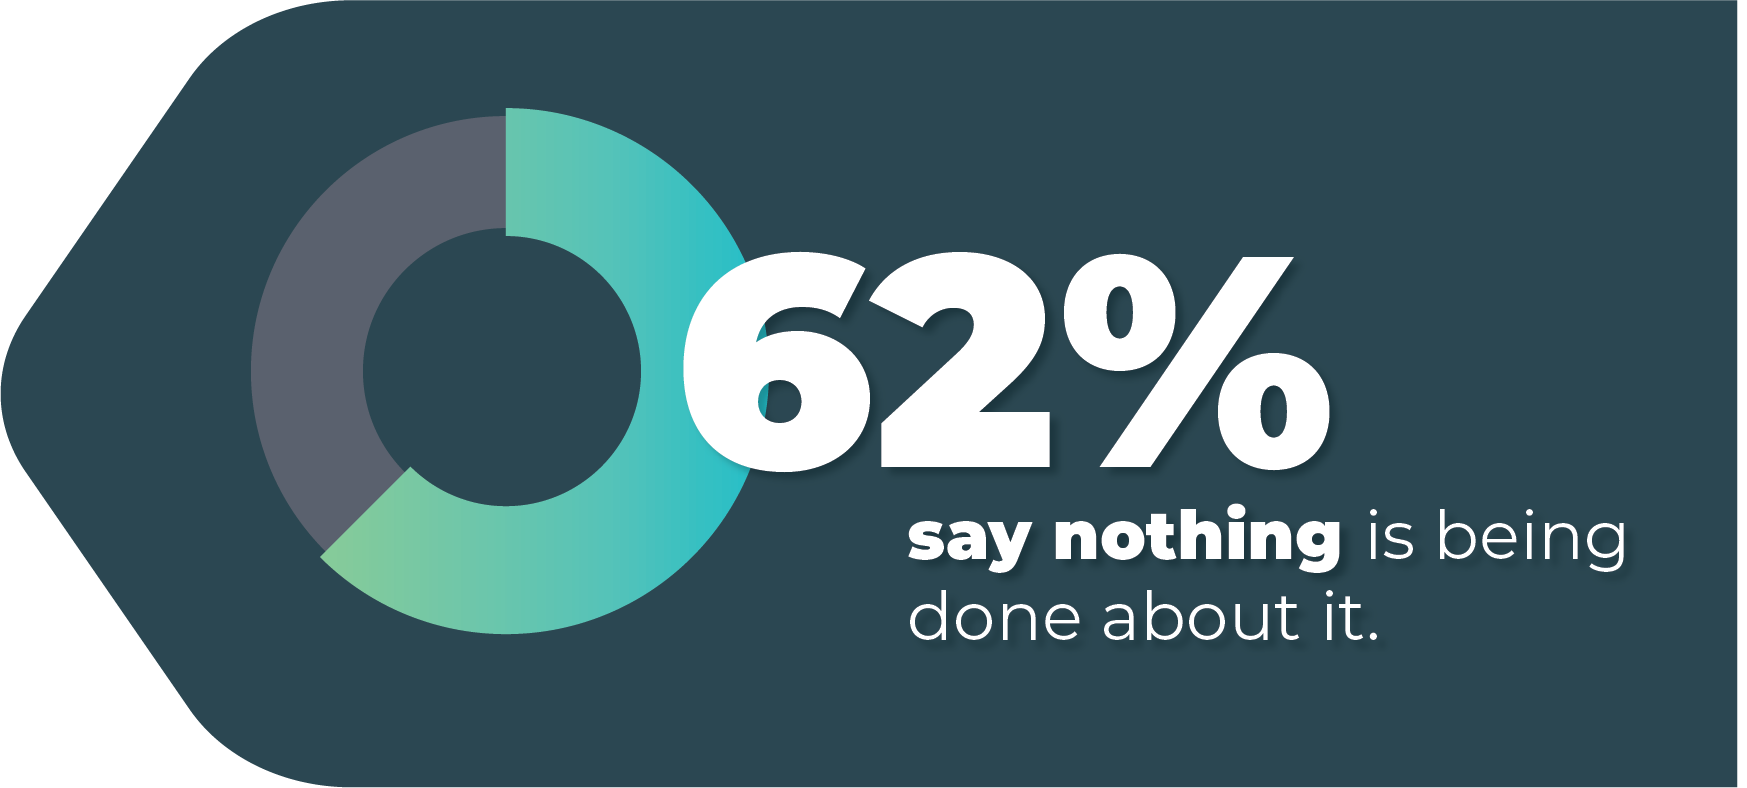
The most vocal people (a.k.a. the "squeaky wheel") are most likely to be prioritized first. BAI does not recommend this 👎. These business areas are also the most likely to be doing nothing to improve it.
Prioritization Rules
20% of business areas have formally documented, and strategic, prioritization rules.
This is disappointingly low as BAI recommends this approach! 👍
Based On KPIs
47% of these business areas prioritize based on either the KPIs of the requesting business areas (29%) or their own KPIs (23%). 👍
Based on ROI
23% of business areas make prioritization decisions based on anticipated (and measurable) Return On Investment (ROI). 👍
First-in, First-out
10% of business areas make prioritization decisions based on a queueing system.
BAI does not recommend this approach. 👎
Other Prioritization Approaches
16% of business areas had other prioritize approaches — Mostly bad. These include HIPPO, political & positional influence, “captain's call”, and at least one “secret back door process that only special people know about”.
Note: Percentages exceed 100% as respondents could select multiple options.
“Thumbs-up” approaches are considered better than the others.
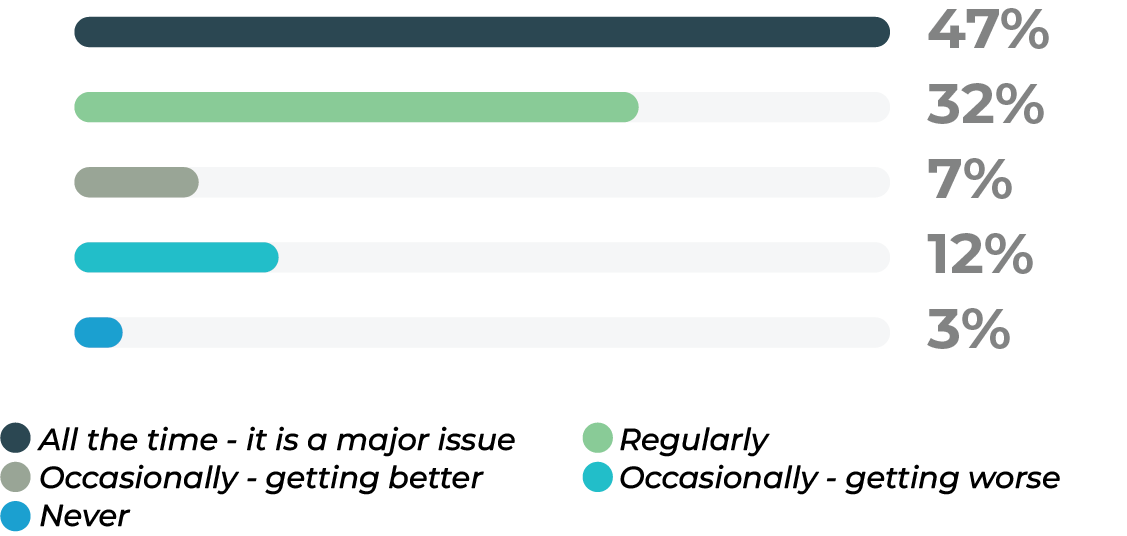
We asked people how frequently they encountered situations where their business area was tasked with delivering more strategically- important work than they had the capacity to handle?
79% of business areas were regularly overwhelmed with work.
Only 3% said they had everything under control and never got overloaded. — We want to work for these companies.
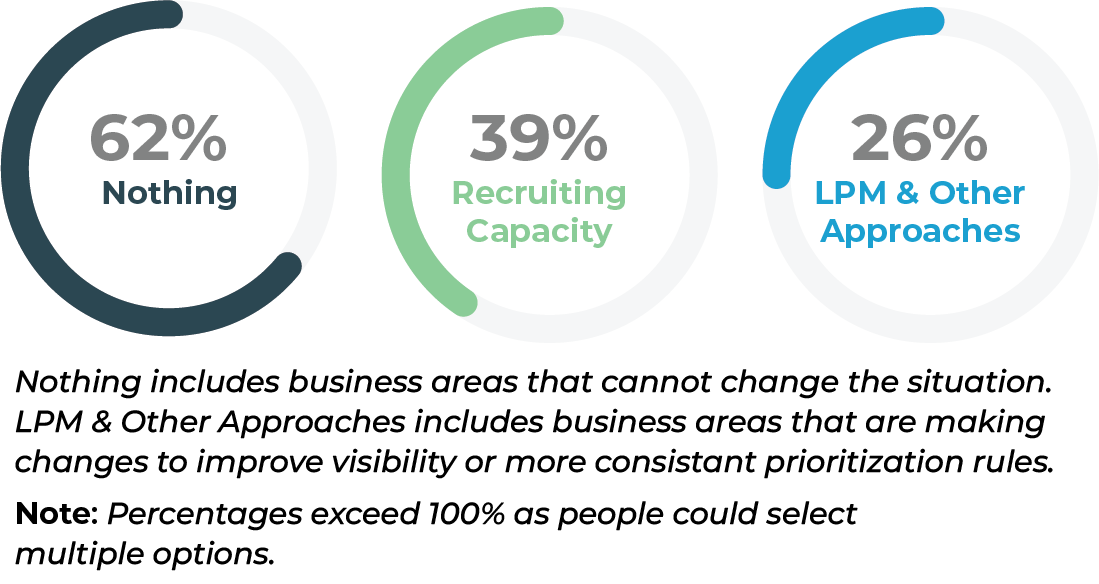
We asked people what was being done to improve their situation.
Of those unable to do anything, 73% were trying to get better at managing expectations, while 27% were truly doing nothing.
Of those recruiting additional capacity, 34% of these were hiring contractors, 45% were hiring staff, and 21% were doing both.
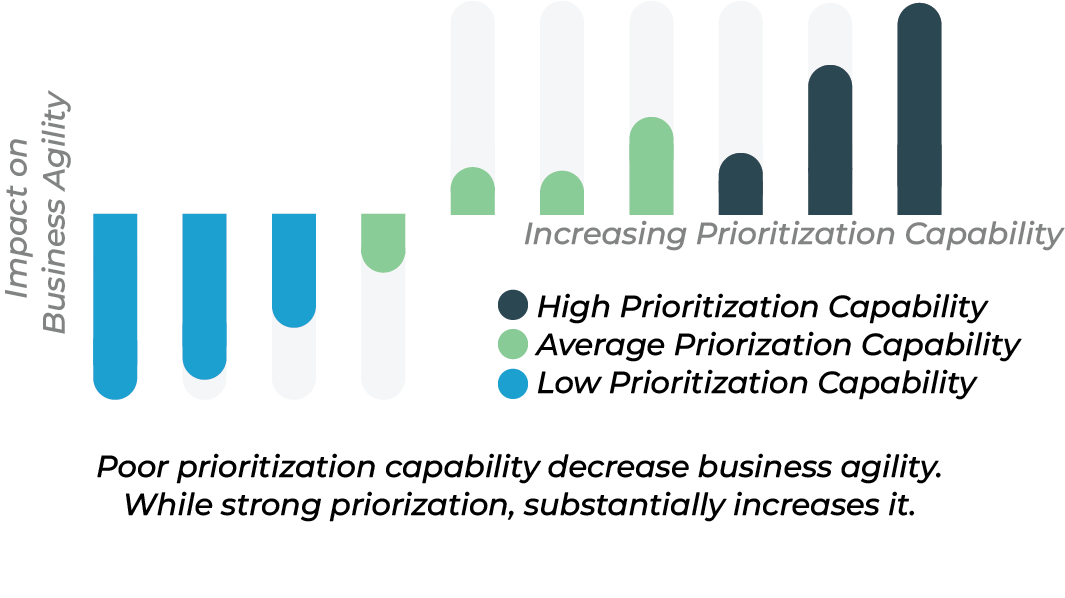
Organizations that rate highly in the Capability Prioritize. Prioritize. Prioritize. report faster decision-making to quickly pivot and adapt to changing business or customer needs. These organizations report more effective use of people and resources and better alignment with market demands.
Strategic Misalignment: A lack of clear strategic criteria (such as ROI) guiding decision-making, coupled with outdated practices, result in commitments that exceed actual capacity and a misallocation of efforts.
Organizational Culture: Resistance to change, siloed structures, and old habits hinders identification of systemic issues. This drives a culture where leaders blame team members for not meeting unrealistic expectations.
Burnout and Attrition: Persistent overcommitment, without substantial efforts to mitigate stress and overwork, leads to burnout, turnover, and dissatisfaction, affecting work quality and delivery timelines.
Ineffective Collaboration: Poor communication and collaboration across teams amplify the challenge of multiple voices (with varying influence) and limits groups from achieving a unified approach to prioritization.
Systemic Inefficiencies: Limited capacity and excessive bureaucracy hamper good business outcomes. And the lack of effective tools leads to poor decisions and, consequently, delays and quality issues.
Unfortunately, the “squeaky wheel” isn’t going anywhere. Create a system for planning and prioritization that works despite that. Your goal is to resolve the challenges associated with prioritization and overwork, leading to improved productivity, employee satisfaction, and overall organizational health.
 Reduce handoffs between business areas either by forming (or extending) cross-functional teams, utilizing business partner roles, and/or changing the responsibility of support teams to define guardrails & provide education (not delivery).
 Create greater visibility of competing priorities and operational demands using approaches such as Lean Portfolio Management (LPM) to enable regular communication and strategic alignment between business areas.
  Experiment with non-linear prioritization models, such as the Kano Model or the Prioritization Pyramid, that provide frameworks for customer-centric prioritization decisions within capacity constraints.
  Adopt, and regularly update, a flexible prioritization system based on practices such as Weighted Shortest Job First (WSJF) or Cost of Delay that considers both the business value and the urgency of tasks.
BAI Research Snapshots provide credible insights into timely and provocative topics for individuals and organizations working towards greater business agility.
Across two global surveys, 115 individuals and 215 organizations provided insights for this report representing a wide range of industries and regions.
Please subscribe and become a member to access the entire Business Agility Library without restriction.