Transformation & Change108
Using Team Data and Insights to Surface Patterns Preventing Better Business Outcomes


Michael S. Mccalla
March 16, 2018
Michael S. Mccalla
March 16, 2018
By: Michael S. McCalla, Lean Agile Intelligence Inc.
Having grown up as BA, I have always gravitated towards data because I enjoy identifying patterns to tell a story. I am also a passionate Agilist, playing the role of change agent in Agile Transformations. Therefore, my natural inclination has always been to couple the two together to drive change.
A few summers ago, I was lucky enough to land an engagement with an organization that valued people, outcomes, and customers. Needless to say the culture was very “Agile!” However, like most great companies, they were never satisfied. They felt their growth had stalled. They hired a few Agile coaches with the hope that we can assist them in getting to the next level of Agility! The goal of the engagement was to identify organizational constraint patterns preventing them from optimizing business outcomes.
The environment was one of safety and trust so we knew data would be our ally. We were confident that it would be reliable and actionable. Our mission as an Agile Practice was to create a direct feedback channel from those doing the work to those making decisions. We collected multiple data points from teams, including self-assessments, happiness, and impediments.
Our Agile Practice took self-assessments to the next level! This was not about an audit, but rather an exercise in which we can all learn from the results, identify improvement areas, and measure the outcomes. We created an improvement and measurement model that leveraged self-assessments as a data gathering technique, and used it at every level of the organization. The model included four steps; understand the team’s strategic objectives, self-assess on the practices that will help achieve them, identify tactical improvement goals, and measure whether or not the improvement efforts are impacting the outcome.
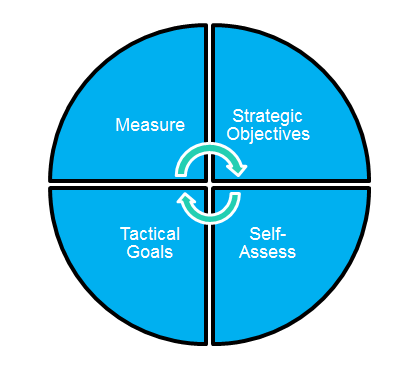
Figure 1 - Improvement and Measurement Model
Given that every team or group is different, we recognized that one universal assessment template was not going to meet the need. Instead, we built a catalog of nearly 100 tried and true Agile and Lean Practices leveraging the materials of thought leaders in the space and our experiences. Each practice consisted of a series of criteria compiled into five separate stages that the team could assess themselves against and identify tactical improvement goals.
After a few hard months of preparation, we met with each team to understand its context and desired outcomes, and built an assessment tailored to their unique needs. We also assisted the teams in identifying metrics to measure if their improvement efforts are helping them achieve the desired outcomes. Overall, this approach allowed us to identify coaching needs across the organization.
For example, the organization was focused on making their products more stable so they can focus more time on delivering new features and not fixing bugs. The self-assessments uncovered many teams were not fluent in practices that lead more reliable such as continuous integration, automated testing, and automated deployment. The data lead to an actionable improvement in which the organization hired more technical coaches.
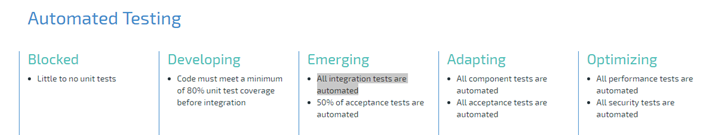
Figure 2 – Self-Assessment Question
To measure the effectiveness of this investment and the team’s technical practice improvements, we tracked leading indicators such as unit test code coverage, automated test %, and failed builds. The lagging indicator used to measure the outcome was escaped defects. After several months of improving our leading indicators, we started to see downtick in production defects, and a smile on leadership’s faces.
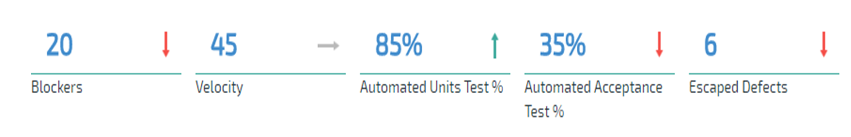
Figure 3 – Metrics
Another data collecting approach we utilized was collating team impediments out of their control. The goal was to identify common impediments and attempt to quantify the impact. At the end of each sprint, the data would be collated across all teams in order to provide a holistic picture of “what” was impacting team performance. The coaches analyzed the data for common patterns and trends. The output of this exercise was items for our continuous improvement backlog.
This technique enabled the coaching practice to identify the shared QA environment downtime was nearly a day and a half per sprint. This blocker impacted over 13 teams. We presented this case to leadership and quantified the delays. As a result, there was an investment made in upgrading the QA environment and increasing its stability.
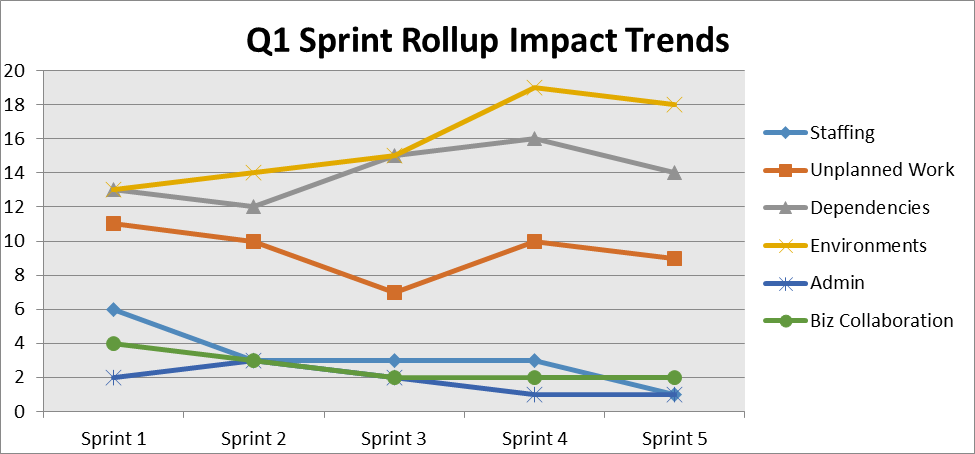
Figure 4 – Impediments
Employee engagement and happiness was a key pillar of the organization. Therefore, we would periodically take the pulse of individuals on the teams to see how they were feeling. The data gathering technique become known as the “Happiness Index.” Thanks to some of the IOS developers, we created an app that randomly pushed out notifications to team members over the course of the sprint. The notification would ask the recipient “how are you feeling?” The options were mad (1), sad (2), indifferent (3), and happy (4). Team members could respond autonomously, or not respond at all. All responses would be aggregated so that teams could see the trends of their happiness. This information was later combined with the impediment roll-ups to see how they were impacting employee morale.
Collecting data in an Agile Environment is an additional feedback loop you can use to make decisions and identify organization constraints. Aggregating these data points to tell a meaningful story can help Agile coaches and leadership to identify behavioral patterns, organizational constraints, coaching needs, and continuous improvement.
Please subscribe and become a member to access the entire Business Agility Library without restriction.