Ways of Working115
Adaptive Design: Increasing Customer Value In Your Organisation


Michael Law
October 5, 2020
Michael Law
October 5, 2020
![]()
How can organisations adapt their organisational design to realise greater customer value?
![]()
This article looks at what customer value is and how it can be influenced by organisational design through structure and customer involvement.
In the past, organisations that thrived in the global market focused on efficiency. Since the start of the century, the global market has shifted, the customer is more aware, employees are expecting more, and incumbent organisations are being disrupted by people-centric competitors. People-centric organisations position the culture of the organisation around the value it produces for customers and employees. By designing an organisation around the customer value and not on efficiency and profit, can incumbent organisations keep themselves relevant?
Customer expectations are changing faster than the organisations’ ability to adapt.
This can be due to the limitations of their organisational design[1]. The organisational design should be inclusive to all elements that make up the value that is produced for the customer[2]. Organisational structure, strategy, and processes that define the design of an organisation can be focused around customers, allowing organisations to move with the changing demands.
Organisational design that once gave a competitive advantage has now created barriers to growth[3]. Disruptive organisations can take market share (Uber), dominate multiple value chains (Amazon), and keep customers purchasing incremental variations in their products (Apple). What we see from these examples: organisations may be able to increase their competitive advantage to compete in a market with changing customer expectations.
Leaders must be aware of all the elements when designing an organisation. Organisational design includes process, structure, technology and people[4]. Although leaders focus on strategic planning, research shows that it is the organisations people that produce greater rewards. But these capabilities can become stagnant. To ensure dynamic capabilities, organisational design must be flexible. We also know that the flexibility of a company, and how often they adapt to external information, has a positive correlation on performance[5]. Organisations trying to obtain a competitive advantage in their industry need to be able to pivot quickly, adapt to new ways of working, & be flexible in their approach, design and deliverables.
 Organisations need to focus on areas of their design to ensure that capabilities and behaviour can best deliver customer value. Strategic agility allows an organisation to respond quickly to new insights, however; traditional organisational design can limit the ability to use strategic agility. Adaptive organisational design is a deliberate strategy for how organisations deliver value in an emergent market (as opposed to design being an afterthought to strategy). This article focuses on two elements of adaptive design; organisational structure and customer involvement and on how that impacts customer value.
To understand how customer value impacts financial performance, we need a definition that can be widely accepted.
Value is defined differently within various industries. Organisations can measure value by the value created. When we discuss value from a marketing perspective, it is customer-oriented and therefore value consumed[6]. Stephan Liozu reviews the many variations of customer value, specifically the difference between value creation vs. value captured. Although the company may be creating value for the customer, the customer hasn’t agreed to the value until they have consumed it[7]. Measuring the value based on the products/services produced doesn’t allow the market to decide the true value[8]. The value created by the organization but not consumed by the customer is waste[9]. Customer value consumed is the difference between the value created and the quantification of that value. The higher the customer value consumed, the higher the potential financial performance through competitive advantage. Value can not only be captured through price until the value is understood[7], otherwise, the organisation could be mispricing and therefore reducing their competitive advantage the organisation provides by solving a customers problem.
100% of successful transformations increased customer value
Value quantification can happen during pricing through negotiation[10]. However, the price cannot be the only metric in customer value[11]. A customer journey map, for example, will allow the organisation to empathise with the value being created, ensuring a real benefit is being recorded to the customer. The ongoing loyalty from customers increases the number of sales per person and reduces the onboarding cost of each subsequent sale, thus brand loyalty can be a metric for customer value[12]. The quality of the product or service can only be determined at the end of a sale, measuring customer satisfaction, and can validate customer value consumed.
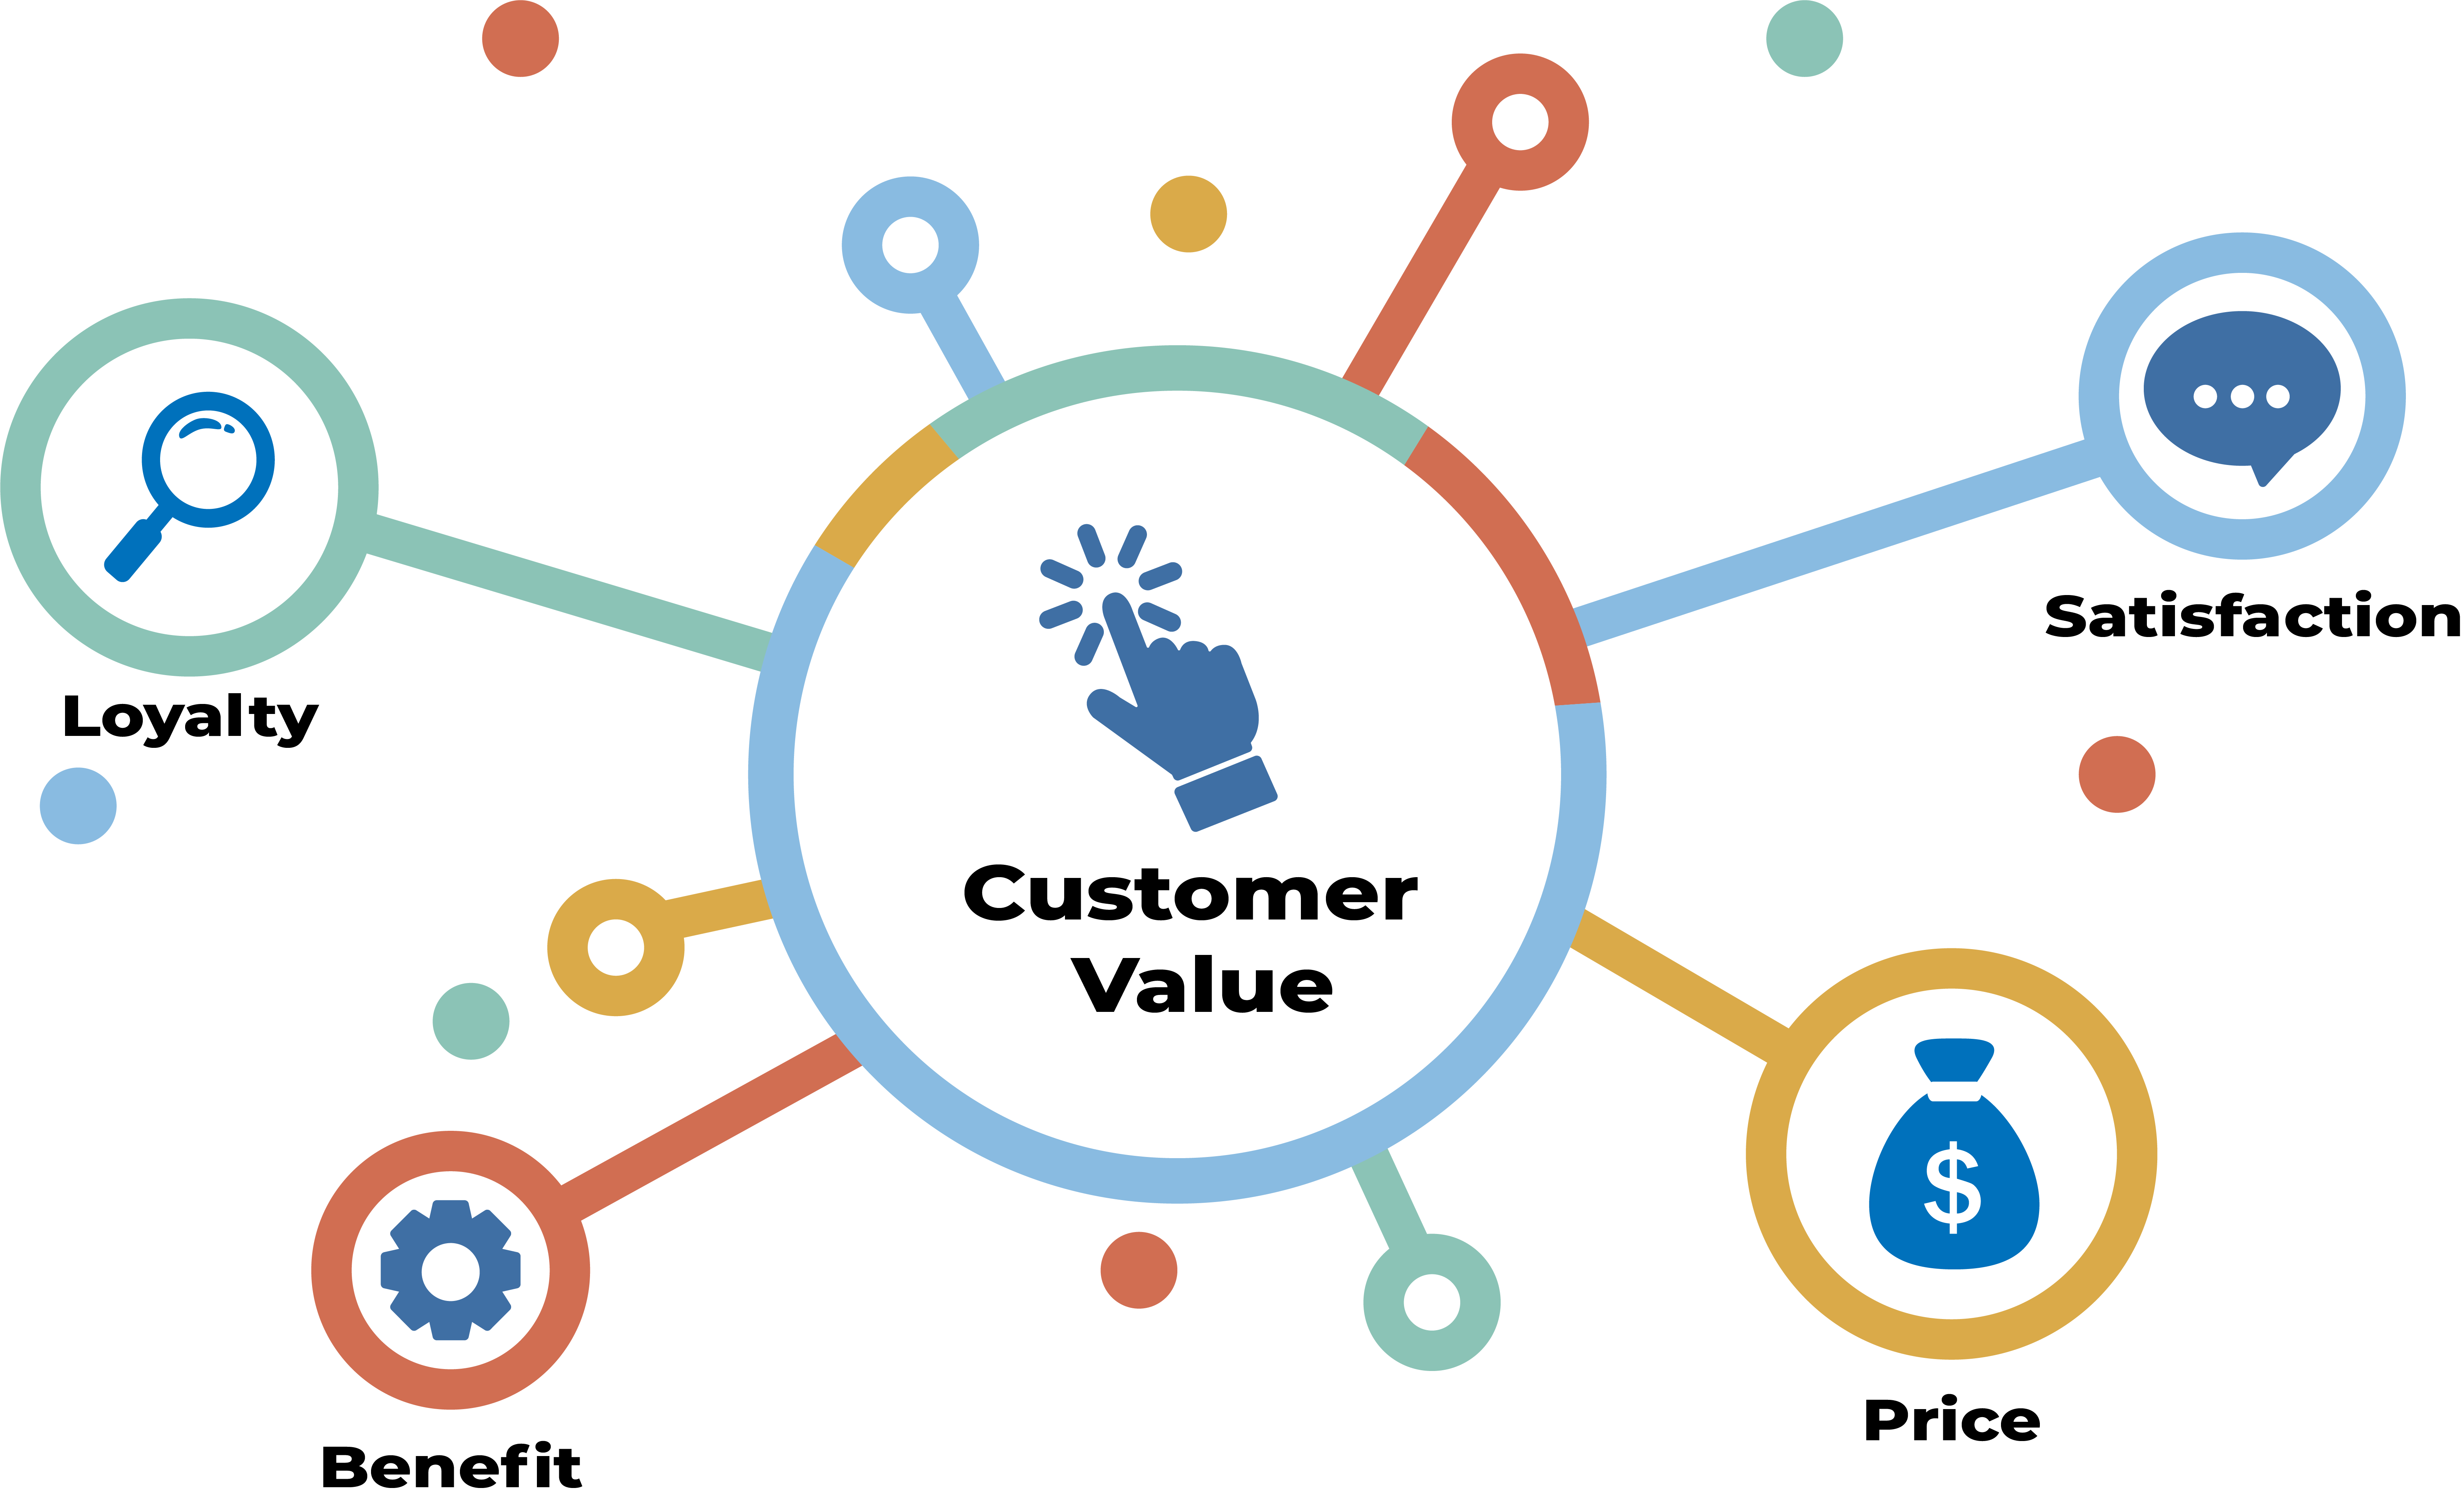
Customer value is the ability for organisations to add value to resources[13], measured by price that the customer is willing to pay[14], the loyalty of brand equity the customer is willing to give[11], the customers’ satisfaction and the functional benefit the organisation gives by resolving a problem.
Financial Performance: The customer may receive social benefits, emotional benefits, functional benefits and have a perceived value, measured by customer satisfaction scores. Measuring customer satisfaction can be a good way to measure the value being consumed after the sale. In Yao et al study, moderate to strong correlations were found on the benefits a customer receives and negative correlations on costs and acquisition costs[15]; showing that customers found value in social, emotional and functional benefits.
The benefit to the customer can come in multiple ways; corporate social responsibility (CSR) has grown in popularity, this social benefit correlates with financial performance. Ali et al found that by focusing on social benefits, organizations can increase the brand value at a lowered cost, driving greater financial performance[16].
Hedonic Value, which is the value of the experience of the customer, is made up of the end to end experience with the product, the company, and the purchase. Hedonic value had a greater correlation with return on assets (0.07), earnings per share (0.11) and loyalty (0.35) then overall value, satisfaction and utilitarian value.

Satisfaction is the measure at the end of the purchase; the overall value is the net benefit to the customer after purchase and utilitarian value is the ability to complete a transaction efficiently[15]. Customer satisfaction is positively correlated to financial performance. Golovkova et al. found the customer satisfaction index measured as earnings per share (EPS) had a strong positive correlation with the financial performance of the banking industry, a highly competitive industry[16]. Sun and Kim found moderate positive correlations on financial performance including return on assets and return on equity using customer satisfaction as a metric[17].
Brand equity is a marketing standard[18]. Brand equity is a concept that gives value to a customer’s perception pre, during, and post-purchase2. Verbeeten and Vijn measured business performance with brand equity and determined that it created a point of difference, which created greater financial performance[19].
The ability to charge a larger margin on top of the resource price is linked to greater financial performance. Perceived value from the customer shows us that they are willing to pay more as they believe they are receiving greater value[20]. Those that focus on profit do not outperform the organisations that focus on customer value[21]. In Ziyambi’s study of financial performance, they found a direct correlation between South African organisations that focussed on customer value over-focusing solely on profit[21].
Brand loyalty, customer satisfaction, sale price and functional benefit are linked to each other either directly or indirectly. Using the four inputs to define customer value, a leader can measure the hedonic value consumed by the customer, then strategically decide to change one or more of these inputs. The academic literature shows a positive correlation with each of the inputs of customer value increasing and the financial performance of a company[22].
To increase customer value via customer value inputs, organisations must rapidly challenge themselves to test new ways of working. To chase new ways of working that measure against customer value, an organisation must be designed to meet those needs. With the correct organisational structure to match the customer and the ability to get rapid direct feedback from the customer, this article shows how these changes increase financial performance through customer value.
Financial Performance Results
As part of this study, we interviewed 23 leaders globally who have moved their organisations to new structures and/or brought the customer closer to their organisation. 100% of leaders that completed a successful organisational redesign found increases in customer value.
Key Info
Structural design in which a firm’s business units are aligned with distinct customer groups, rather than product groups.
The current environment is volatile, uncertain, complex and ambiguous (VUCA)[23]. Companies that once were dominating the field have been disrupted; companies like Kodak, Blockbusters and TomTom have been pushed aside by Apple, Netflix and Google.
The ability to understand customer needs instead of company needs allows companies like Netflix to drive innovation faster than their competitors. Google’s rapid evolution leveraging data to interpret aggregate customer needs allows them to change their strategy to match. Apple brings in real customers to test their products before release to ensure they solve a problem. Although there are many ways to structure an organisation, a common approach is to structure through a pyramid hierarchy, based on functional deliverables. In a complicated environment, efficiency gains were thought to occur with functional structures[24].
The premise of functional organisational structures is that efficiency leads to productivity. This may be the case when the customer demands do not change, and the motivation of the employees is constant. However, in today’s complex environment we see customer demands changing through culture, technology, and education continuously[25]. Constant change is the new norm, increasing the need for adaptations. Focussing on efficiency or throughput can result in a higher risk of delivering solutions that customers do not want or need[26], thus lowering the production of customer value.
Customer-centric structures allow employees to deliver value to customers with no dependency from others in their organisation[27]. This structure keeps the focus on the end to end value, limiting the barriers to getting work done through handoffs and motivating employees around the customer value produced. Although the impact could result in lower efficiency[28], the risk of deploying solutions that customers do not want is decreased, resulting in higher motivation for employees[29] and customers have a seamless experience, resulting in production the customers are willing to buy[30]. Dynamic capabilities are linked to greater financial performance[31], and understanding missed opportunities[32].
Dynamic capabilities are defined as “the firm’s ability to integrate, build, and reconfigure internal and external competences to address rapidly changing environments.”[27]
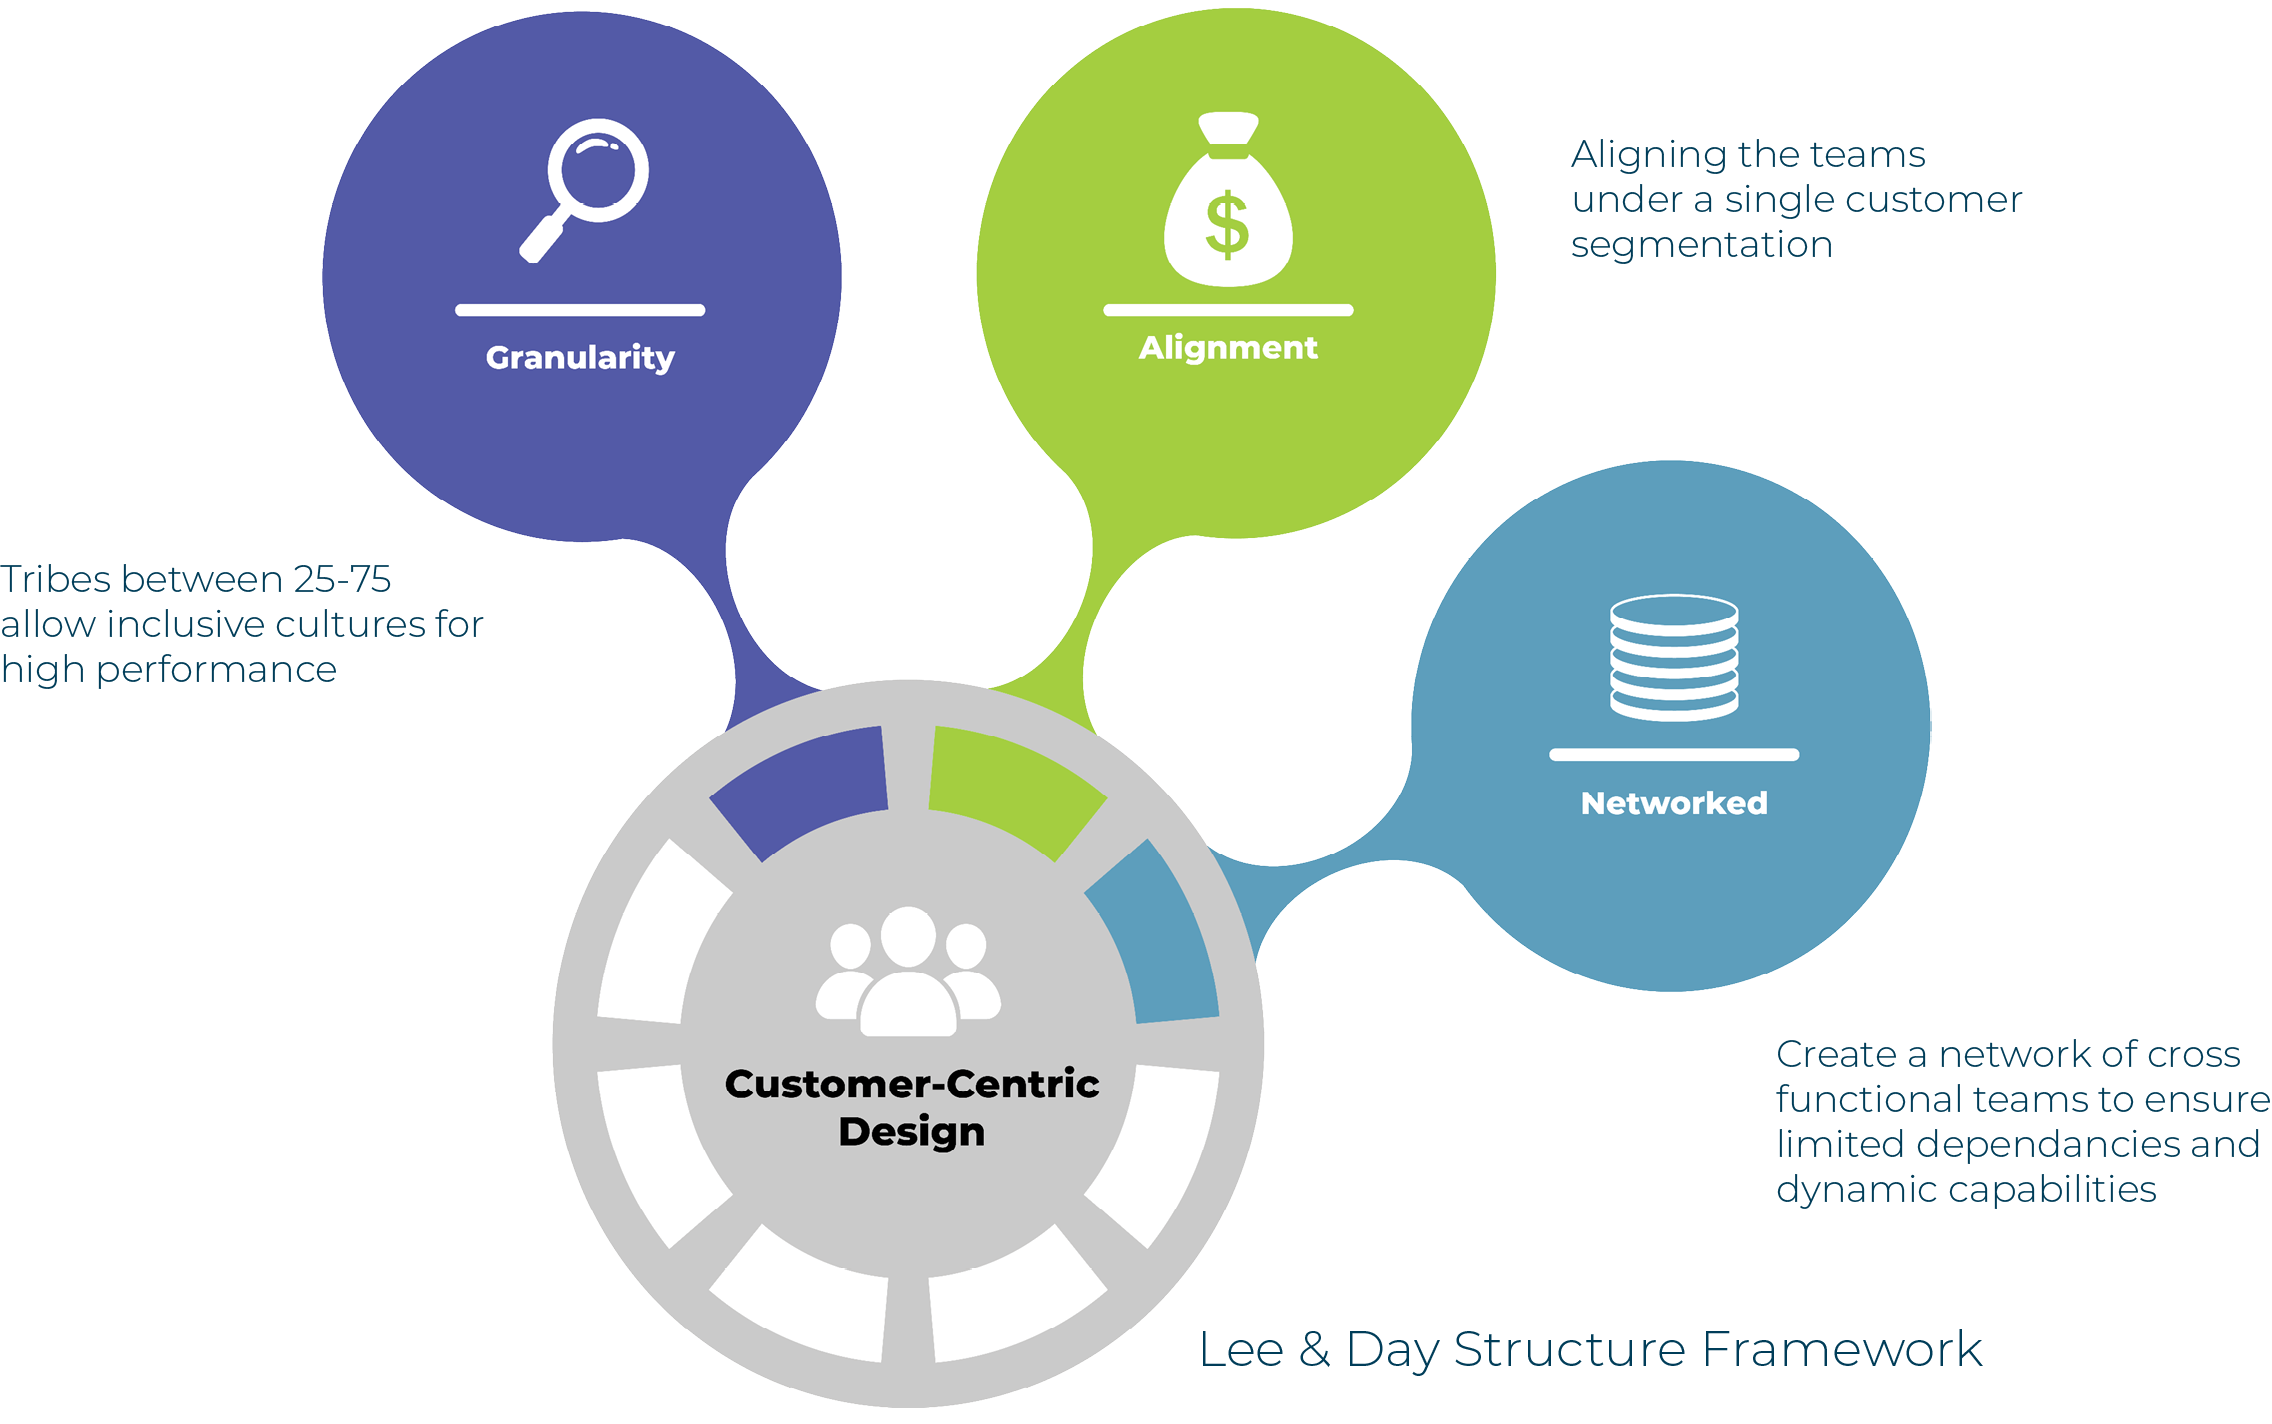
To obtain dynamic capabilities, Lee and Day created a framework for a customer-centric structure that gives hypothetical dynamic capabilities to adapt to new requirements[27]. In 2011, Day described the importance of a fluid marketing organisation that anticipates and adapts to new customer demands, allowing rapid prototyping of new initiatives for customers[28]. Lee and Day go further in their journey together in 2018 to deliver a way for organisations to transform[27].
Lee & Day focus on aligning each business unit with a single customer segmentation, networking teams for cross-functional delivery and more granularity to decrease the number of steps from value creators and customers (See diagram 3) With additional alignment with the customer, it allows organisations to shift quickly on new information[27] and aligns to customer insights sooner[34] by identifying shifts in their chosen customer segmentation. Greater accountability for teams to serve the customer ensures dynamic capabilities. Porter describes in a Harvard Business Review webinar that companies will need to create structures that give closer relationships with the customer if they want to keep their competitive advantage[36]. Disaggregating business units into smaller sizes increases agility[27].
Tribes can be between 25-150[37]. At the higher end of 150, our neuro-capability to form relations causes a decrease in agility, however, this high number is designed to be short-lived in extreme environments[38]. To maximise culture and productive benefits, a tribe between 25-75 is recommended.
Logan and Dunbar’s research does not take into consideration the reduction in employee loyalty and the increased connectivity of today’s social world. The number for a tribe would be lower than it would be in the 1990s and substantially lower in cultures where empowerment is normal. There is a downside to smaller sized units, coordination costs increase, making the positive impact of customer satisfaction mute[39].
Leveraging from the work of Arons, Driest, and Weed on the Orchestrator model, Lee and Day stress the importance of a network from the grass-root level. Lee & Day articulate the need for customer-centric design. Financial performance may be subject to organisations that have moved to customer-centric designs early and have benefited, however, those that go late are disadvantaged. In the same way that if all companies move to customer-centric designs, the benefit is mute due to the organisation lacking in competitive advance, this does not take into account the loss of competitive advantage that would have happened if the company had not transformed.
Lee and Day in 2015 evaluated the impacts of moving to customer-centric design, against not moving. The results show a negative financial impact as the coordination costs were more than the results from customer satisfaction[40]. However, they do not take into consideration Keller’s consumer brand equity, additional margins that may be included in the price to represent non-functional benefits nor do they isolate business to business customers from business to consumer customers[41].
The results from this meta-analysis show greater customer satisfaction with customer-centric structure design[40] and creating greater value to the customer[42].
Customer satisfaction is increased by customer-centric structures[40]. The increased customer satisfaction leads to old customers returning, new customers joining[43], the ability to adapt to future changes by having a closer connection to the customer – customer retention[44] (and being more nimble when changes happen[40]).
Key Points
 Customer value was defined as an increase in customer satisfaction, brand awareness, financial performance and/or greater functional benefits delivered on average to the customer. From the twenty-three leaders, 85% of the leaders defined their transformation as a success and fifteen interviews identified it as moving organisational structure (OS) only. There were varying reasons as to why the leader believed this was a successful transformation (ST). The leaders measured multiple ways to determine success; customer satisfaction (48%), financials (33%) and no metrics (19%) were the most common. For 85% of the sample who deemed their transformation a success, 100% of them measured an increase in at least one metric of customer value.
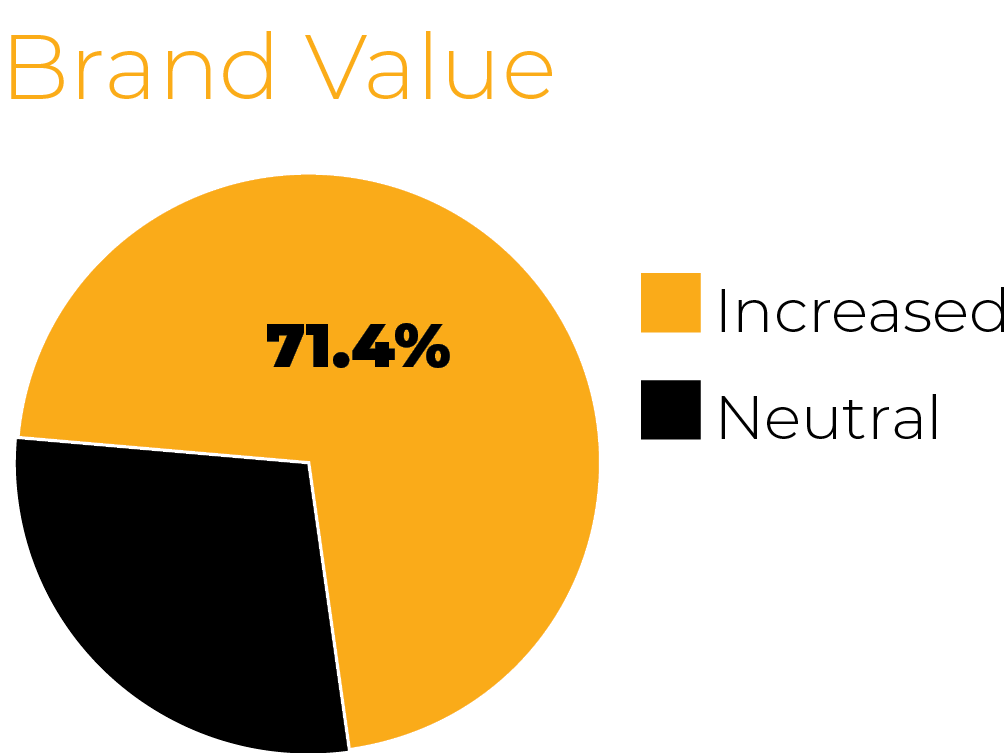
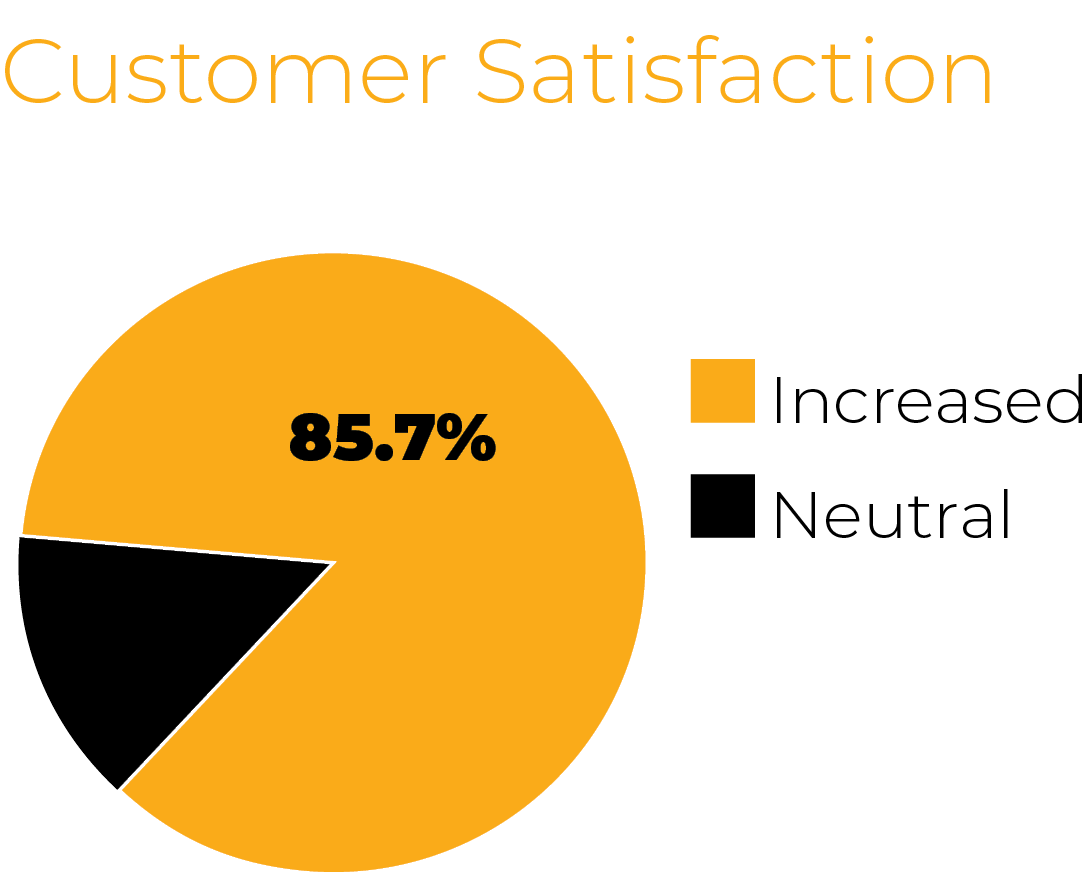
The customer was commonly held at the centre of the change. Leaders measuring net promoter score (NPS), customer happiness, and social interaction as key metrics to determine if the customer satisfaction had increased. Customer satisfaction increased in 85.7% of the successful transformations. Increasing brand value was measured by increasing the productivity per employee on average and/or increased sales per customer. Either metric would mean that the customer would have a lower onboarding cost per future sale and/or would increase the number of customer sales. It is worth noting that 25% of interviews were government organisations and thus the question was positioned about the usage of the product/service that was being used. Brand value increased by 71.4% of the sample with a successful OS.
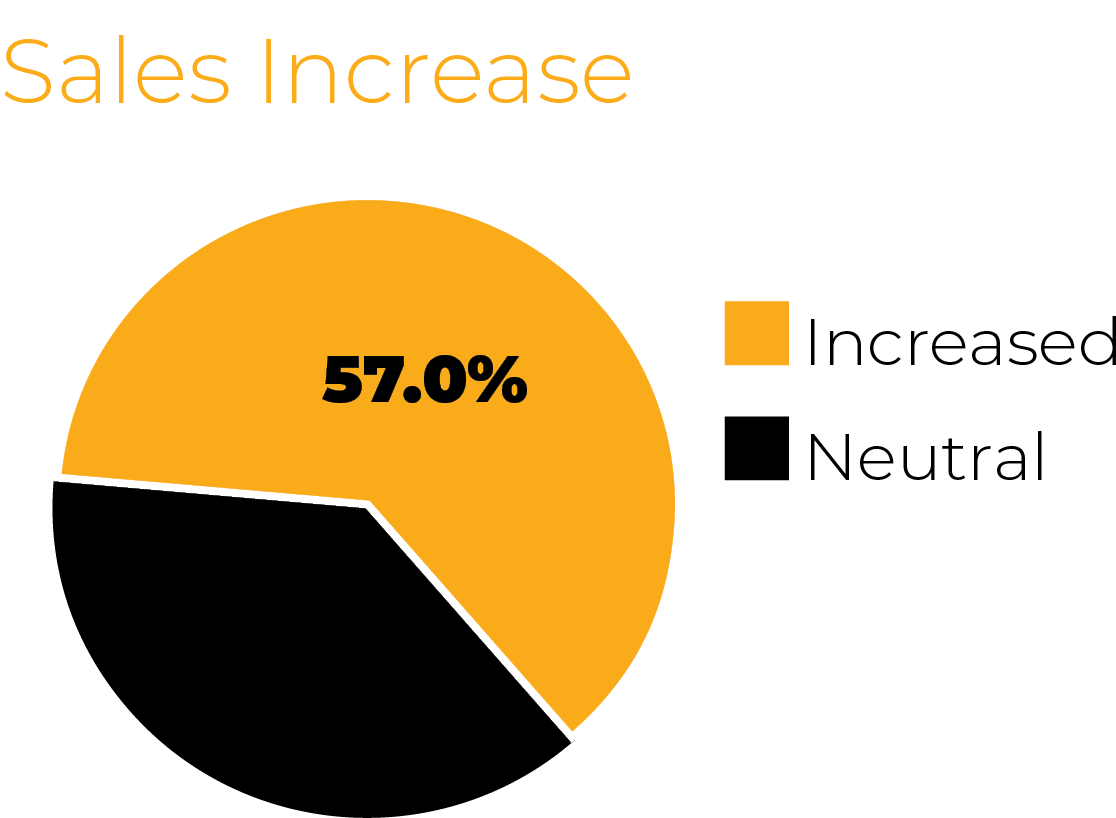
Discerning if financial performance increased was difficult for the leaders in our study. One theory was that there wasn’t enough time to really see the impact; however, 57% believed that sales/use of their products had increased, bottom line profits had increased or cost of deployment was less, thus increasing their return on investment.
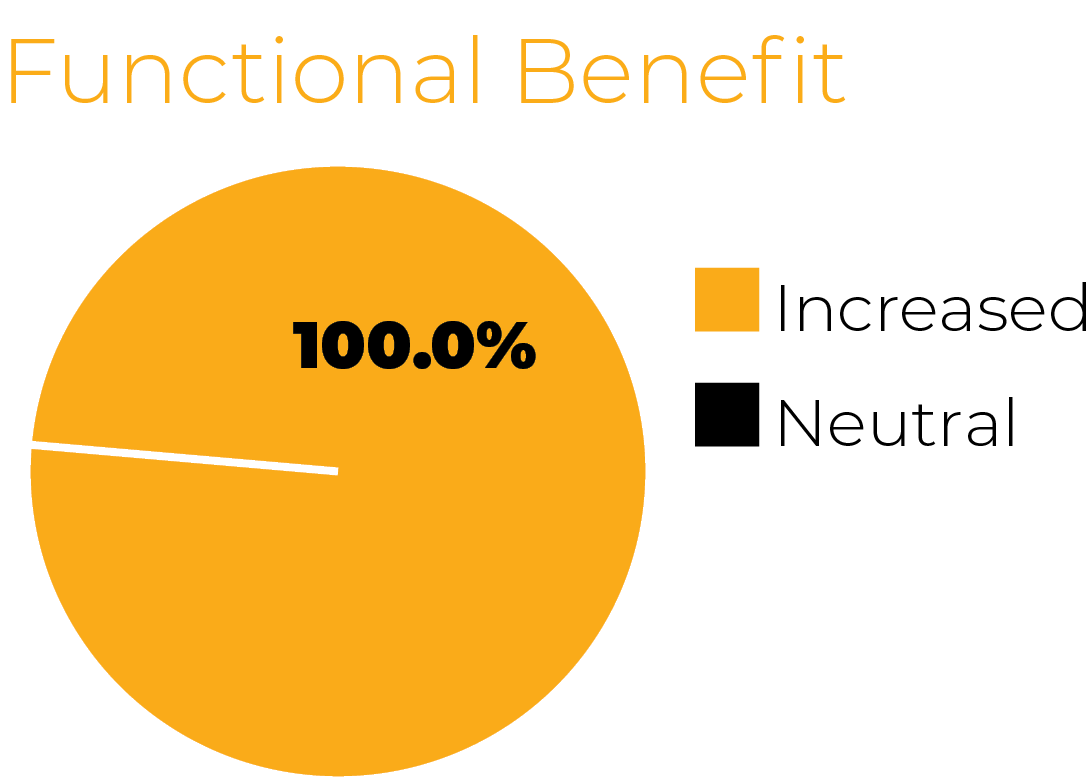
Reduction in waste by not producing features/products that were not used means the aggregated functional benefit to the customer would be increased. Reducing time to market ensures a faster and more affordable cycle time, allowing the customer to receive greater benefit over the lifetime. Using those two metrics as qualifiers resulted in 100% of leaders of successful transformations to identify with increases in functional benefit.
“We needed to focus on customers; without customers we don’t have a business” – MICHAEL SCHNEIDER, Managing Director Bunnings Group

“Not involving the customer in the process can develop groupthink”
Although structuring the organisation around the customer can create benefits; not involving the customer in the process can develop groupthink, compelling the organisation in the wrong direction and increasing the risk of producing less value for customers[45]. It has been thought historically that involving the customer could lead to intellectual property leaks and making the customers aware of the limitations of the organisation. However, by being transparent in the journey of the organisation, the limitations and willingness to pivot based on the customer need, the organisation will find greater loyalty and customer satisfaction; resulting in greater customer value.
Leaders seeking to increase their organisation’s competitive advantage need objective data in order to fund transformation programmes. Customers can be involved in the organisations at various stages, this article looks at how customer involvement in product development impacts customer value.
Vision and strategy start from the board of directors. Customer involvement in setting strategy, creating a vision and holding the chief executive accountable is more effective for an organisation when they are less diverse[47].
Bommaraju et al. found in their analysis of 329 business to business firms that having a customer on the board had a medium correlation of 0.331 with the firm’s performance. However, when markets are complex this becomes a moderate correlation of 0.527, arguing that a customer on the board can be at least as important as a marketing executive on the board.
Having customer involvement at the strategic level can ensure a true customer view is taken into account. This can help the customer value increase by focusing on social and/or emotional value directly. Corporate social responsibility (CSR) is an example of customer demand where customer involvement can shape the board towards social value which may be more aligned to what the customers want to see organisations achieve. Innovation leads to financial performance and research shows that only 25% of new products are successful in the market[48].
Accessing the success factors of innovation allows organisations to focus on what is most likely to succeed in the market. Evanschitzky, Eisend, Calantone, and Jiang updated Henard and Szymanski meta-analysis for product success, taking results up to 2012 and allowing today’s culture to be included.
Customer input into the new product development was a weak correlation of 0.21, however, greater than technology superiority (0.06). Of this meta-analysis, a weak correlation of 0.21 was the highest recorded; customer input and reduced cycle times shine a light on getting the product into the hands of the customer and validating a hypothesis quicker[49].
As per our T-Test analysis there was an increase in overall customer value, by increasing customer involvement within a customer-centric structure. However, there was differentiation between customer representation (Product owner) and end customer involvement.
There has been no evidence that meta-analysis measured customer involvement where a company was already structured around the customer, this leads this author to believe that the majority of the negative correlation was with targeting the wrong customer and the customer not being able to adequately influence change in the organisation, thus reducing the effectiveness of the customer involvement. It is worth noting that Szymanski and Henard found a correlation of 0.41 with customer input against product success, all of Syzmanski and Henard results were higher correlated to success than Evanschitzky et al. (2001); this may be due to markets and cultures adapting and reducing first mover advantage.
Saldanha, Mithas and Krishnan found that it is vital to have customer involvement for achieving outcomes (2017). Information technology departments must continuously innovate to keep or grow their competitive advantage. Collaborating with customers isn’t enough, the customer must be involved as part of the team from start to finish, to increase performance and innovation[50]. Saldanha et al. found a weak correlation between product customer involvement and innovation (0.10). They did, however, find a moderate negative correlation with innovation having information-intensive customer involvement (-0.32).
When involving a customer, merely focusing on surveys or limited contact with customers isn’t enough to increase innovation and company performance[51]. More in-depth involvement, like being on the team, helps to build relationships. Li et al. found that building customer relationships increased performance of an organisation by increasing trust and commitment (2019).
Cross-functional teams, including the end customer, were found to mitigate the risk of the customer viewpoints being neglected. Lagrosen found that getting customer input was troublesome for organisations[52] which also builds on “the importance of the relationship is to build together”[51] . Voice of the customer is developing a relationship with the customer, through constant interactions from start to finish of product design[53].
When developing a product, there are many points in which a customer involvement can be beneficial; board-level customer involvement in vision[47], strategy design[49], product design[53] and product development[52] have positive impacts on the success of the product. Customer involvement increases trust and loyalty[51] and reduces the risk of customer upset after purchase.
“Increasing customer involvement in the customer-centric organisational structure will increase customer value”
Customer satisfaction can be recorded throughout the vision, strategy and product development[52], (instead of at the end of the process) to mitigate any upsets. Brand loyalty increases with better customer understanding and trust[53]. Increasing brand loyalty or customer satisfaction can be strongly correlated to re-purchase and customer championing the organisation[54], therefore cost reduction in the customer retention would be a direct result of involving the customer, increasing customer value so the net cost-benefit is less.
Organisations currently focus on their product development without the customer, can lead to waste. Although stakeholder engagement can help mitigate issues, this is often a tick box rather than full participation that may not cover a lousy management decision. Some organisations use customer feedback surveys to get data from the customer. Feedback directly from customers is promoted, however, there is room for error as customers may not tell the truth, and the surveys are historical in nature[55].
Having the customer embedded into the product initiation will ensure that the customer’s voice helps shape the product, transparency is delivered, and the product reduces the risk of delivering features that do not solve the customer’s problem, thus reducing project costs and increasing the chance of product success[56]. Customers being involved in the product initiation was a concern for organisations with expensive intellectual property, however, with the rate of change increasing, secretive approach to strategy development has run its course in favour of the greater customer experience.
To increase customer involvement in the structure, the structure must already be in place or on a journey to be doing so. Therefore, during our interviews, we identified leaders who had brought the customer into the structure from product strategy to deployment. Our leadership sample was eight. Customer involvement ranged from permanent positions to regular contact with the customer to ensure the products being delivered were aligned to their needs.
Key Results
As part of our research, we asked variable control questions to seek indicators that helped explain the differences in customer value. Seeking board approval to make the change showed a negative weak correlation with a customer value of -0.223. It is worth mentioning that 100% of the failed transformations sought and obtained board approval.
The chief influencer having a clear and unwavering vision for success was moderately correlated with customer value (0.651). There were two distinct types of methods being used with the twenty-three leaders. A project style design and implementation in one large release of structure, tools and processes, and a continuous delivery, where things are tested and measured, then kept or discarded. Continuous improvement method moderately correlated with customer value (0.503) over transformation.
The size of the company and the number of change agents allowed this study to create a ratio, there was a negative correlation, albeit weak at -0.062 with a higher ratio of change agents to total FTE being impacted. The size of the company was split into segments, and a smaller company did have a weak correlation with greater customer value at 0.196.
Customer Value Breakdown Correlations
In this study we evaluated how specific inputs to customer value correlated with each other. This is relevant when transforming to adaptive organisational design because you can strategically increase multiple areas simultaneously. For the inputs of customer value, the majority had a moderate correlation with each other, supporting the hypothesis that they are directly and indirectly related to each other. The weakest correlations from our study was on the price metric, showing price increases and functional benefit/customer satisfaction had only a weak correlation.
Risks and Issues
The common risks that were not expected by the samples before getting started were people related. People-centric risks made up 58% of risks. Common people risks were a lack of vision from the chief influencer, executive changes, and political positioning in middle management positions. Mitigation of people risks happened by the creation and stability of a vision and buy-in from the chief influencer, this report found that 76.5% successful implementations had a clear, unwavering vision and 66.7% of unsuccessful implementations didn’t.
How can organisations adapt their organisational design to enable greater customer value realisation?
From this article, we have obtained data from twenty-three case studies and cross-referenced them against academic literature. It is this author’s recommendation that organisations can transform from their functional structures to focus on the customer and can obtain greater customer value from doing so. Greater customer value will increase financial performance over the mid to long term, not in the short term. The cost of transformation must be taken into consideration, it is not this author’s recommendation to perform this transformation if leaders are looking for financial performance in the next financial year as the majority of the sample had taken over eighteen months to receive benefits.
If an organisations’ competitive advantage is decreasing in their industry, the organisation has enough funds to perform a transformation, and the organisation has the right leadership to sustain the change iteratively, then this author believes that restructuring around the customer will increase customer value and thus increase competitive advantage, resulting in greater financial performance. A continuous improvement plan behind a clear objective would allow a transformative leader to find bespoke ways to obtain adaptive design.
Current State
Initially, the transformation leader should measure the current state of the organisation, you can use examples like Surge’s Business Agility Radar or Business Agility Institute Report. What is the organisations purpose and which customers do they wish to serve? To identify the customer, documenting the value chain is recommended because this will help leaders identify where their organisation sits on the end to end delivery of customer value. Using service design methods, leaders can use the value chain to identify who the customer is, create a customer journey map, and match a pilot to deliver value independently.
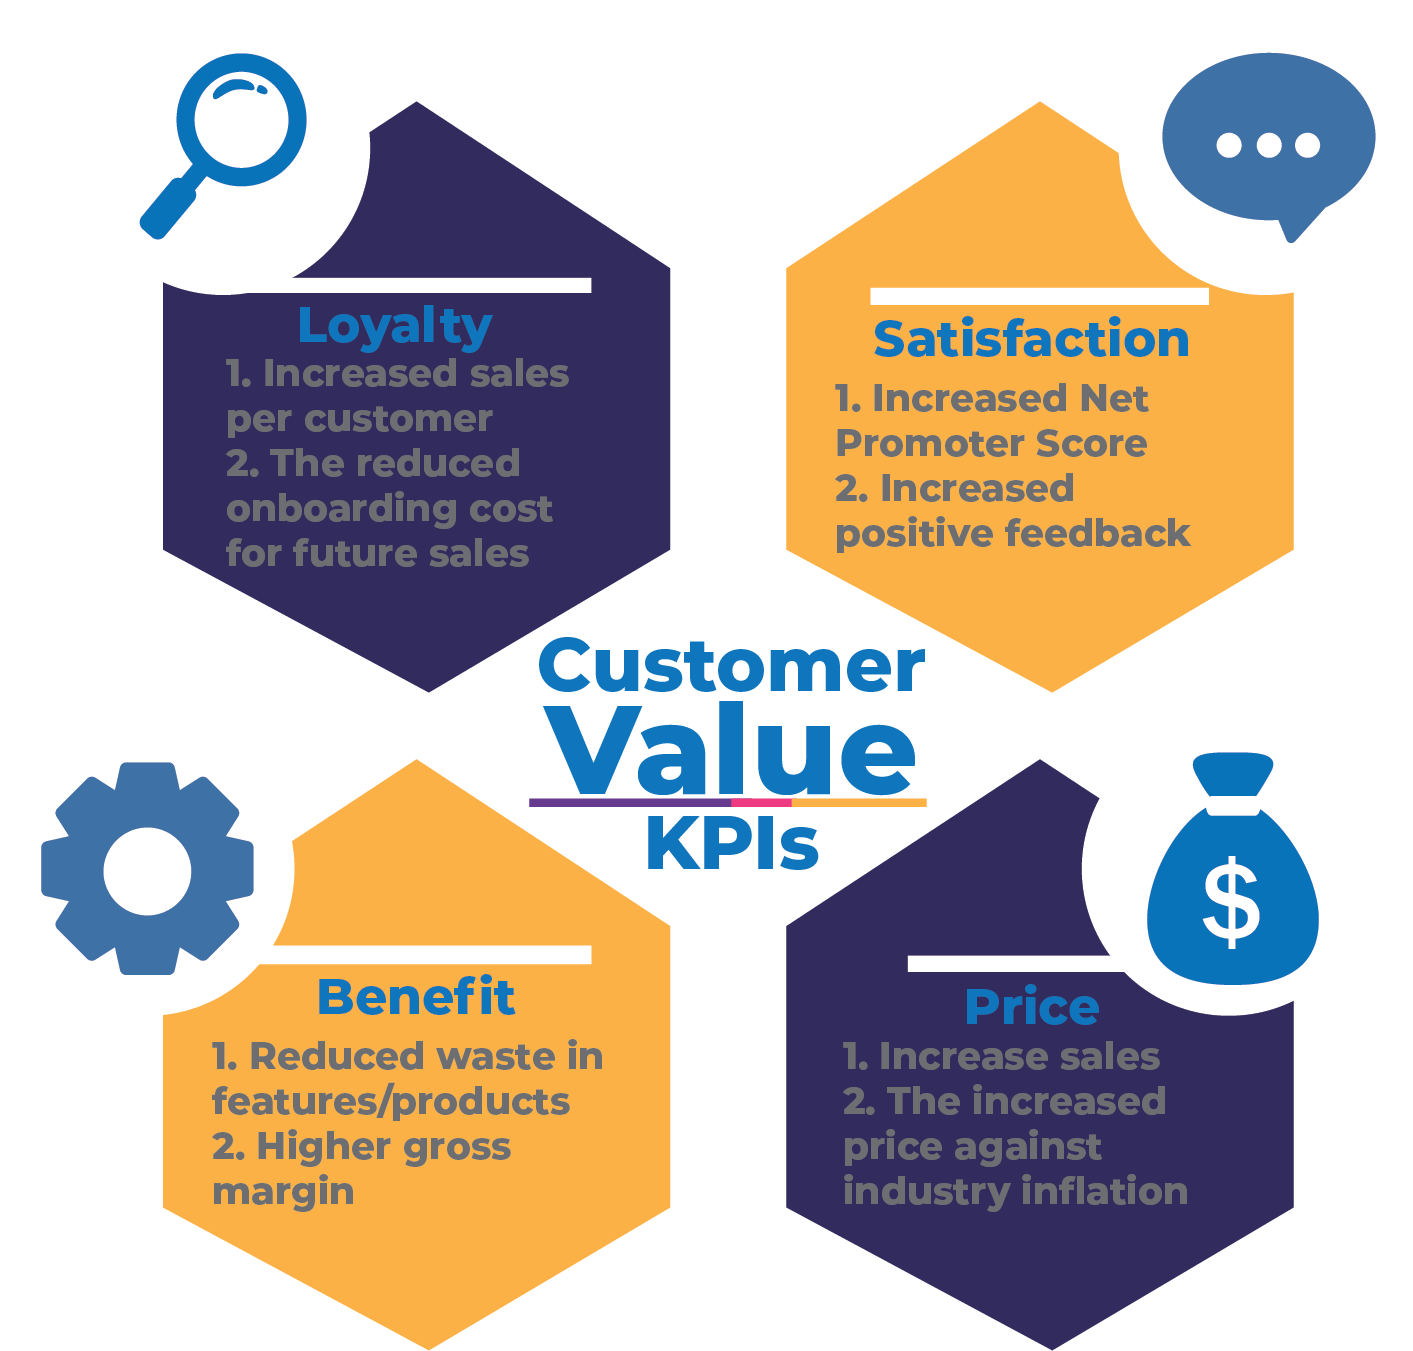
Customer value can be measured by four inputs: Brand Loyalty, Customer Satisfaction, Functional Benefit and Sale Price. Two metrics for each input can be recommended from our successful case studies as these KPIs indicate customer value is increasing. It would be advantageous to use what would suit your organisation best.
Measuring the organisation’s current state via the customer value KPIs, the organisation can create outputs on a continuous improvement plan to test a hypothesis and measure the impact of the change. Leaders could identify and structure a pilot, create a vision to deliver value for an individual customer segment and continuously scale what works to the organisation. Once the objective has been met, the organisation can test greater involvement with the customer to see if the KPIs increase above the investment of the involvement. Finding internal customer representation can be a low-cost option to test greater customer involvement.
It is hard enough to be a leader in an environment that is volatile, uncertain, complex and ambiguous. It is harder yet to hear all the conflicting sales pitches by consultants on which new transformation will help their organisation next. This article provided clarity around adaptive design, we used data and case studies to articulate what customer value is and how it impacts financial performance through competitive advantage.
Customer value is made up of four inputs, measured by price that the customer is willing to pay, the loyalty of brand equity the customer is willing to give, the customers’ satisfaction and the functional benefit the organisation provides by resolving a problem.
An organisation can be limited by its structure, processes, and leadership. Specifically, if an organisation structures around the customer and brings the customer closer to the decision-making process, the organisation increases customer value. We found that brand loyalty, customer satisfaction, functional benefit, and price can increase with customer-centric structures, while customer involvement increased value with lower value being captured by customer representation.
Key insights show that a continuous improvement approach to organisation design has a greater chance of success than a larger transformation. Aligning a pilot to one customer segment to show value before scaling can reduce risks of failure. Key failures can happen when the transformation is only at a grassroots level. Without strong leadership and a clear transformation goal, transformations can fail to scale. With a top-down approach, bureaucratic impacts can also prohibit customer value. A mixture of grassroots and strong leadership is required for successful
implementations.
We showed that by transforming an organisations design through continuous delivery, focussing on one outcome at a time, incumbent organisations will have a fighting chance at competing in this global volatile competitive world.
“Unless someone like you cares a whole awful lot, nothing is going to get better. It’s not.” – Dr. Seuss
 Michael focusses on lean business innovation, agile coaching and deliberate strategic planning. With sixteen years in business development, Michael has learnt to approach problems critically, ensuring a balance of consultation and educational leadership to deliver customer value.
With an executive MBA from Massey university, specialising in business transformation, ICAGILE qualification to certify in Business Agility and the founder of Surge.Coach, Michaels purpose is to partner with leaders to maximise their organisations potential.
Michael focusses on lean business innovation, agile coaching and deliberate strategic planning. With sixteen years in business development, Michael has learnt to approach problems critically, ensuring a balance of consultation and educational leadership to deliver customer value.
Please subscribe and become a member to access the entire Business Agility Library without restriction.