Business Agility Conference 2018 Wrap Up
by Evan Leybourn, March 23, 2018
And it's a wrap. After a year of planning, we've pulled off another successful event. And, if I do say so myself, even better than the first. There were certainly hiccups and issues along the way (I'm looking at you NYC weather), but I think it all came together fantastically in the end.
Interesting Stats
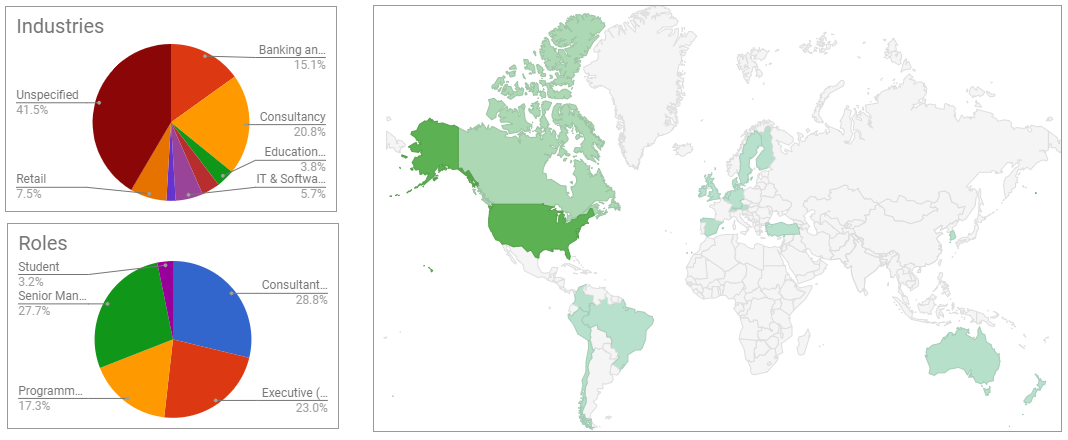
The event itself was bigger and better than last year. We had nearly 350 delegates; from coaches to executives, from over 20 countries representing almost every industry. Some interesting stats from those people who shared their personal information;
- Consultancies (27%), Financial Services (17%), IT & Software (16%), Healthcare (5%), and Retail (5%) made up the bulk of the attendees.
- We had 15 graduate students from the International School of Management in France. They'll be heading back to school soon and leading the change in their curriculum.
- 23% of our attendees were senior executives in their organisations, 28% came from the "frozen middle", 17% programme/project managers, 28% were coaches and individual contributors with the last 4% being the aforementioned students.
- Nearly 40% of attendees came from overseas. Canada (14%), Australia/New Zealand (5%) and Chile (5%) were the largest single contingents. With more delegates coming from Brazil, Turkey, Russia, South Korea, and nearly a dozen European countries. Perhaps more impressive is that 96% of attendees came from outside New York.
Rediscover all the amazing talks and takeaways from our 2018 conference